
Size palm oil equipment from the fruit supply that the mill must process during its busiest credible operating period, then check whether the proposed line can also operate sensibly when supply falls. Annual tonnage alone is not enough. The calculation needs a defined material basis, a delivery pattern, realistic productive hours, and an explanation of how temporary queues will be cleared.
This approach separates a supply forecast from a machinery selection. The forecast describes fruit that may reach the gate; the selection describes equipment expected to handle that fruit under stated conditions. Keeping those two records separate makes it easier to revise a project when plantation development, buying arrangements, or operating hours change.
Build the Supply Record Before Choosing a Capacity
Start with monthly fresh fruit bunch receipts where reliable records exist. For an operating mill, reconcile weighbridge records with procurement and production reports. For a new project, distinguish measured nearby supply from projected output and fruit that another mill may already be purchasing.
Record the source and confidence level of each estimate. Plantation area is not itself a delivery guarantee: crop maturity, harvesting arrangements, transport access, and competing buyers can change the material actually available. A supplier needs those qualifications to understand the demand placed on the proposed line.
Divide the supply estimate into committed, probable, and speculative volumes using definitions agreed by the project team. These are planning categories, not statistical probabilities unless the underlying analysis supports that interpretation. Keep possible future expansion outside the base case until its timing and likelihood are clear.
FAO’s small-scale palm oil processing discussion places raw-material availability before machinery selection. That principle remains useful when building a supply-based model. Its historical regional capacity and investment examples should not be copied into a current project as though they were current market quotations.
Move from Monthly Tonnes to a Daily Processing Duty
A monthly figure becomes useful only after the team states how many days the mill expects to receive and process fruit. If 2,400 tonnes arrive during a month with 24 processing days, the arithmetic average is 100 tonnes per processing day. That calculation says nothing about whether particular days receive substantially more than average.
Review the busiest weeks and delivery days separately. Harvest schedules and transport arrangements may concentrate receipts even where the monthly total looks moderate. Where detailed records are missing, develop a clearly labeled peak scenario and make collecting arrival data an early operating priority.
Do not add several overlapping peak factors without checking what each represents. A monthly peak allowance followed by a daily surge allowance can be reasonable, but only if they refer to distinct variations. Otherwise the model may count the same uncertainty twice and overstate the required equipment size.
Count Productive Hours Rather than Opening Hours
A mill that is staffed for 12 hours does not necessarily process fruit continuously for 12 hours. Planned cleaning, inspections, startup, interruptions, and material shortages affect usable production time. Decide which losses are represented explicitly and which are covered by a single availability assumption.
One transparent planning expression is required running throughput equals daily FFB mass divided by productive hours. Productive hours equal planned operating hours multiplied by the assumed productive fraction when that fraction is the chosen method. Keep the time basis consistent throughout the model.
For an illustrative day requiring 100 tonnes of FFB processing, 12 planned hours and a productive fraction of 0.80 give 9.6 productive hours. The calculated requirement is 100 divided by 9.6, or approximately 10.42 tonnes of FFB per productive hour. This is a planning result, not a machine rating.
A supplier still needs to assess whether the proposed connected equipment can deliver that duty with the actual feed and utilities. Rounding the result to a convenient commercial capacity does not replace that assessment. Record the selected configuration and its confirmed operating basis alongside the calculation.
Test the Sensitivity Before Adding More Equipment
| Illustrative daily FFB duty | Productive hours | Required running throughput |
| 100 tonnes | 12.0 hours | 8.33 tonnes/hour |
| 100 tonnes | 9.6 hours | 10.42 tonnes/hour |
| 100 tonnes | 8.0 hours | 12.50 tonnes/hour |
| 120 tonnes | 9.6 hours | 12.50 tonnes/hour |
The table uses assumed inputs to show how time and arrival volume change the answer. It does not predict any particular mill’s availability. The first row assumes every planned hour is productive, while the other rows describe different productive-hour or delivery cases.
Use sensitivity results to identify which information deserves better evidence. If a small change in productive time changes the proposed line size, investigate the causes of downtime and the operating plan. Buying a larger machine may be less useful than resolving a persistent transfer interruption, but the comparison must use actual project data.
Discuss alternative shift patterns with the operating team before treating longer hours as free capacity. Extra operation may require staffing, supervision, maintenance access, and reliable services during additional hours. Before adopting the longer shift, put its staffing and service requirements into the same planning record as the extra productive hours.
Check Queues Using Arrivals and Processing Together
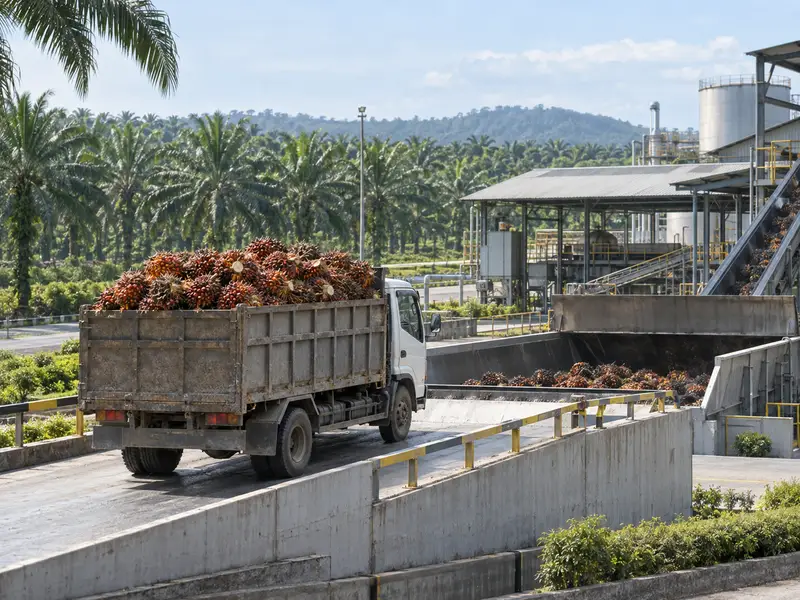
Daily totals can hide a receiving problem. A day with 100 tonnes delivered in a short afternoon window creates a different queue from the same mass arriving steadily. Plot cumulative arrivals against cumulative processing to see when the largest backlog occurs and whether it clears within the planned operating period.
For each interval, the closing queue equals the opening queue plus arrivals minus material processed, with processing limited by material actually available. Use one consistent unit, such as tonnes of FFB. If the queue remains positive at the end of the period, decide how the next period will begin rather than resetting it artificially to zero.
A buffer can absorb a temporary mismatch, but it does not create additional long-term processing capacity. Repeatedly receiving more than the line processes produces an accumulating backlog. Because fruit handling time affects processing quality, a larger storage area should not be treated as a substitute for a workable supply and production schedule.
Ask the equipment supplier to review the receiving and transfer duties separately from the steady processing rate. Vortech Global’s palm oil equipment range includes distinct process stations; the appropriate receiving arrangement depends on how those stations are connected and fed. Specify the arrival scenario behind the requested arrangement.
Translate the FFB Duty into Station Duties
Fresh fruit bunches, separated fruit, press feed, crude liquid, nuts, and recovered kernels are different streams. Their mass flow rates cannot all be assumed equal. Prepare a preliminary flow balance and ask the process designer to confirm the stream basis used to size each station.
For batch equipment, divide the usable batch mass by the full cycle time, including the activities that prevent the next batch from starting. Multiple vessels may overlap in operation, but shared handling equipment or utility limitations can prevent their theoretical capacities from adding directly. The actual operating sequence must support the claimed combined duty.
The article on choosing vertical sterilizer capacity discusses that station in more detail. This supply model provides the upstream demand that such a selection must meet. Keep the two calculations linked so that a changed daily arrival forecast triggers a review of the batch arrangement.
When comparing screw press equipment, ask whether a quoted capacity refers to prepared fruit or an equivalent FFB basis. Request the conversion assumptions in writing. A nominally larger number is not evidence of higher line capacity when the two suppliers are measuring different material streams.
Give the Low Season Its Own Operating Case
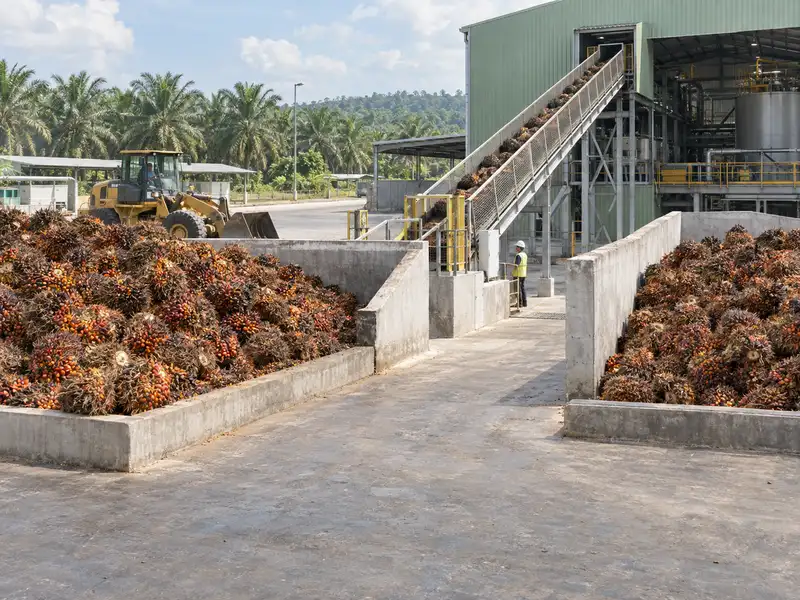
After checking the peak, calculate the duty in a representative low-supply period. Ask how the proposed equipment will be operated at reduced throughput, including any batching, scheduling, or minimum feed requirements stated by the supplier. Do not assume every machine can run efficiently at any fraction of its rated capacity.
For some projects, operating on fewer well-organized days may be considered; for others, fruit availability and handling requirements make that unsuitable. Evaluate the actual supply chain and quality requirements before choosing a pattern. The purpose of the low-season case is to reveal operating consequences, not to prescribe a universal schedule.
If modular expansion is proposed, show what the first phase must handle and what a later phase would add. Include the shared services and transfer equipment in the expansion boundary. The existing article on upgrading a small mill provides broader context, while the capacity model should state the specific trigger that would justify an additional module.
Separate Reserve Capacity from Unsupported Optimism
A reserve allowance should have an identifiable purpose, such as a documented arrival surge or a planned expansion stage. Name that purpose and show where the allowance enters the model. An unexplained percentage can hide uncertainty without resolving it.
Likewise, do not assume a future recovery improvement will compensate for inadequate FFB processing capacity. The supply model needs a fruit-processing rate; the proportion of oil recovered belongs in a separate performance calculation. A project may need to improve one, the other, or both, but the planning model should keep them separate.
The start-up equipment configuration guide can help buyers understand the range of sections involved in a mill. Use it alongside a project-specific capacity calculation rather than adopting a configuration solely because another start-up used it. Similar business size does not guarantee similar arrival patterns or utility conditions.
Issue a Capacity Basis Sheet for Supplier Review
Summarize monthly and peak-day FFB supply, planned operating hours, productive-time assumptions, arrival concentration, and expected low-season duty on one sheet. Attach the supporting records and identify unverified estimates. Add the required product boundary and a note describing future expansion separately from the initial duty.
Ask the supplier to return a station-by-station capacity explanation, including batch timing, stream definitions, and utility assumptions. Require exceptions to be visible. If the supplier recommends a different operating pattern, update the model and compare the consequences before approving the change.
Keep the original assumptions when the mill starts operating and compare them with actual receipts and production time. The differences will show whether the constraint came from supply, scheduling, equipment, or supporting services. That record is more useful for the next investment decision than a single nominal capacity printed on a quotation.