
Two palm oil machines both described as 5 tonnes per hour may perform very different duties. One rating may refer to fresh fruit bunches entering the mill, while another refers to prepared fruit entering a press. To compare palm oil equipment correctly, identify the material stream, measurement location, time basis, and operating conditions attached to every capacity figure.
This is especially important when equipment is purchased from several suppliers or added to an existing plant. A list of apparently matching nameplate capacities does not demonstrate a balanced production line. The interfaces between the machines determine whether the proposed arrangement can handle the required production duty.
Name the Material Before Reading the Number
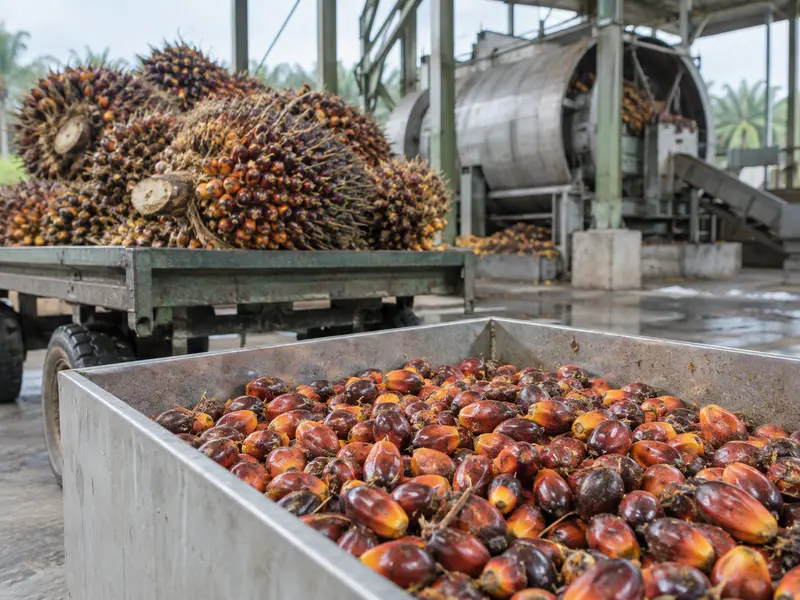
Fresh fruit bunches include the bunch structure as well as the fruits. After threshing, the stream feeding later fruit-processing stages no longer contains the same material in the same proportions. Additional separation, water addition, and removal of solids change the streams again further along the line.
The FAO palm oil processing chapter describes the sequence of receiving, threshing, heat treatment, digestion, pressing, clarification, and kernel recovery. Use those process boundaries to label capacity figures. The exact sequence and equipment arrangement depend on the process selected, so a stream list should follow the actual project flow diagram.
Useful labels include tonnes FFB per hour at reception, tonnes of prepared fruit per hour at a press inlet, and cubic metres of liquid per hour at a pump. A kernel-processing machine needs its own feed description. Replacing all these labels with a general phrase such as plant capacity removes information that the buyer needs.
FFB-Equivalent Capacity Requires a Declared Conversion
Some suppliers describe downstream equipment using an equivalent fresh fruit bunch throughput. That can make a quotation easier to read, provided the conversion assumptions are visible. The buyer should ask which material fraction, operating conditions, and process arrangement connect the actual machine feed to the stated FFB equivalent.
Consider a purely illustrative mass balance in which a selected processing stream represents 0.60 tonnes for every tonne of FFB entering a defined boundary. At 10 tonnes FFB per hour, that stream would be 6 tonnes per hour. The calculation is 10 multiplied by 0.60; the fraction is an assumption for this example, not a universal fruit fraction or a product specification.
If a machine is rated for 6 tonnes per hour of that stream, its equivalent FFB capacity is 6 divided by 0.60, or 10 tonnes per hour under the same assumption. Change the stream fraction and the equivalent figure changes. This is why an unexplained FFB-equivalent rating cannot be used confidently across different feed conditions.
For a real project, replace the illustrative fraction with an engineering balance supported by the applicable process data. Include water or other material added inside the boundary and identify streams that leave it. Do not use an oil extraction percentage to convert fruit feed into press capacity; it measures a different relationship.
Distinguish Running Throughput from Daily Production
Tonnes per hour normally describes a rate, while tonnes per day describes a quantity accumulated over a stated period. The two are related only when the operating duration and time losses are specified. A quotation stating daily output should therefore include the assumed production hours and any conditions behind that output.
For example, a machine processing 4 tonnes of its specified feed per productive hour would process 32 tonnes during eight productive hours. If only six of the planned eight hours are actually productive, the quantity becomes 24 tonnes at the same running rate. Neither calculation establishes the amount of oil produced.
Record startup, cleaning, and stoppages consistently. A test can report the rate while the machine is running and also report total material processed across the entire test period. Keep the running-rate result beside the total-period result so the reader can see both the machine’s active performance and the time lost during the trial.
Convert a Batch Rating Using the Full Operating Cycle
A vessel holding several tonnes per batch is not automatically a machine processing that many tonnes every hour. Its effective rate depends on loading, treatment, depressurization where applicable, discharge, and the preparation required before another batch begins. Use the supplier’s defined complete cycle rather than one selected treatment stage.
A hypothetical usable batch of 8 tonnes completed every two hours averages 4 tonnes per hour across repeated cycles. Two identical vessels do not necessarily deliver 8 tonnes per hour as a system. Shared loading equipment, steam demand, or discharge arrangements may prevent both from following their ideal schedules.
Ask for a timing diagram showing the sequence of each vessel and each shared resource. The diagram should expose conflicts rather than assume they disappear. Vortech Global’s guide to vertical sterilizer capacity provides additional context for this station, while the project timing diagram must reflect the selected equipment and utilities.
Check the Difference Between Mass and Volume Flow
Liquid-handling equipment is often specified in volume per time, whereas mill production is commonly discussed in mass per time. To connect a volume-flow specification with a mass-flow requirement, obtain a density value appropriate to the particular liquid and its operating state. Crude oil, diluted press liquor, and slurry should not automatically receive the same density assumption.
The arithmetic relationship is mass flow equals volume flow multiplied by density, with compatible units. If an illustrative stream has a density of 0.95 tonnes per cubic metre and flows at 10 cubic metres per hour, its mass flow is 9.5 tonnes per hour. These inputs demonstrate the calculation and are not a recommended design basis for a palm oil stream.
A pump also needs more than a volume-flow requirement. The system resistance, operating conditions, solids characteristics, and applicable material compatibility affect selection. Ask the equipment supplier to define the duty point and review the connected piping rather than selecting a pump from a flow number alone.
Do Not Confuse Throughput with Recovery or Oil Yield
Throughput describes how much feed passes through a defined boundary in a defined time. Oil yield may describe the oil obtained relative to feed mass, while extraction efficiency may describe recovered oil relative to oil available in the feed. The denominator must be stated each time because these percentages are not interchangeable.
In a simplified example, 100 tonnes of FFB entering a reporting boundary and 20 tonnes of recorded crude oil leaving it produce a mass ratio of 20 percent. That ratio does not, by itself, tell the reader what fraction of all available oil was recovered. It also needs consistent inventory and measurement boundaries before being interpreted as an operating result.
Similarly, residual oil in a sampled material needs a clear sample identity and reporting basis. A number reported on dry solids cannot be compared directly with a number reported on a wet sample. The laboratory method and sampling procedure belong beside the result.
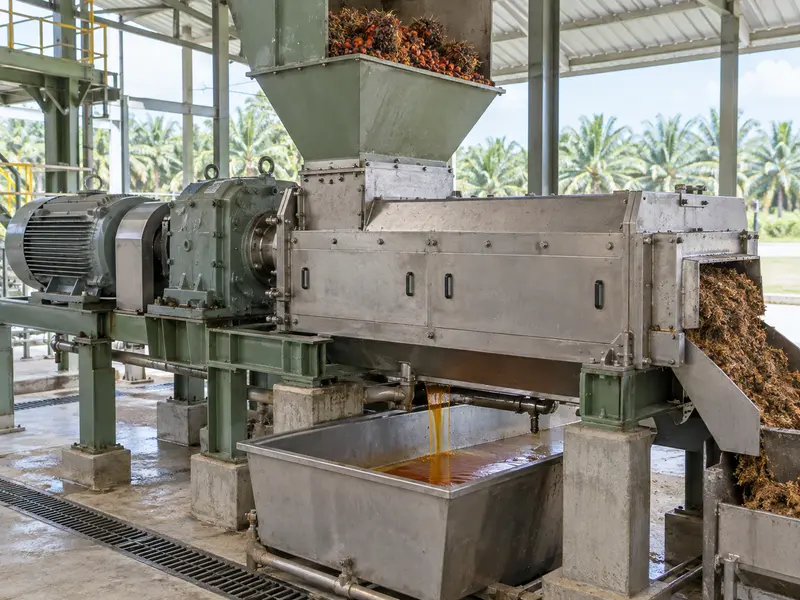
When considering palm oil screw press machinery, request model-specific capacity and performance definitions. Do not combine the most favorable throughput from one configuration with the best residual-oil result from another unless the supplier confirms that both apply together. A range overview is useful for initial discussion but cannot replace a project data sheet.
Build a Common Capacity Comparison Sheet
| Quoted item | Information needed | Comparison mistake to avoid |
| FFB reception rate | Arrival pattern and material basis | Treating average arrivals as peak duty |
| Press feed rate | Prepared-feed definition and conditions | Comparing directly with FFB mass |
| Sterilizer batch load | Usable load and complete cycle | Ignoring loading and discharge time |
| Liquid flow | Stream, density, and duty point | Equating cubic metres with tonnes |
| Oil recovery figure | Numerator, denominator, and test method | Treating recovery as throughput |
Keep the supplier’s original units in one column and add a separately calculated comparison basis. Preserve the conversion assumptions and the person responsible for confirming them. This lets a reviewer trace the normalized figure back to its source instead of relying on an unexplained spreadsheet result.
Request clarification whenever a field is missing. A blank operating-hours assumption is not permission to choose the most favorable interpretation. If a supplier cannot yet confirm a value, carry it as an open issue and identify the design decision that depends on it.
Find the System Constraint Rather than the Largest Number
A connected line can be constrained by a transfer point or supporting service as well as by a major machine. An upstream station may wait for discharge space, while a downstream machine may remain underfed. Looking only at the largest equipment ratings misses these interactions.
Start with the process arrangement on the palm oil equipment page, then create a project-specific flow diagram with material and time bases attached. Compare the capacities of adjacent stations after converting them onto compatible terms. Where the conversion is uncertain, ask for additional process information before declaring the line balanced.
The site’s article on preventing oil loss concerns another important part of mill performance. Keep loss analysis connected to, but distinct from, capacity analysis. Increasing feed rate without checking product quality and separation performance can make a throughput figure look better while other operating results deteriorate.
Apply the Same Definitions During Acceptance Testing
Before a trial, identify the feed measurement point, the start and end times, and the treatment of material already inside the equipment. Record whether the test includes startup and interruptions. A steady running test and an entire-shift production test should be labeled accordingly.
Agree how sampling and measurements will be witnessed and recorded. Instrument condition, sample handling, and stock changes can affect interpretation. The relevant specialist and supplier should define the procedure for the actual equipment, rather than relying on a generic online checklist as a complete test method.
If the result misses the agreed requirement, first establish that the test used the agreed material and conditions. Then investigate the equipment and system constraints. Changing the denominator or omitting stoppages after the trial does not resolve the underlying performance question.
Use Capacity Definitions to Improve the Next Quotation
For each proposed machine, request one sentence stating what material it handles, where it is measured, how much it handles, and under what time and feed conditions. Attach the relevant data sheet and keep exceptions visible. A buyer can use this short statement to identify missing assumptions before reviewing the rest of the proposal.
Buyers working through the start-up configuration guide can apply this check to every item in the proposed line. Ask Vortech Global to clarify ambiguous ratings before matching equipment across stations. A consistent set of definitions gives purchasing and engineering a reliable basis for comparing proposals and planning a meaningful trial.